-
Products
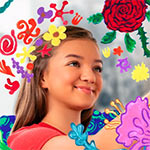
Creativity Starts Here
Explore Crayola products, created to encourage creative expression, foster learning, and fuel imaginative fun.
Browse All Products
-
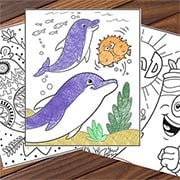
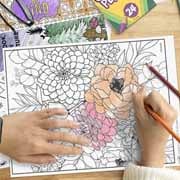
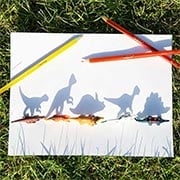
Coloring
Explore Free Coloring Pages!
Inspire imagination and fun for kids of all ages.
Browse All Free Coloring Pages -
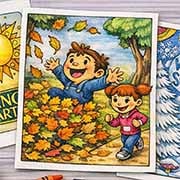
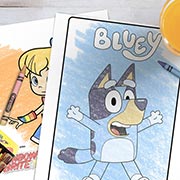
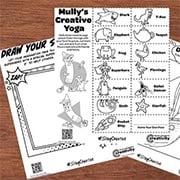
Create
Fresh Ideas & Activities
Have a creative moment today with free activity sheets, ideas, and more.
Browse All Ideas & Activities -
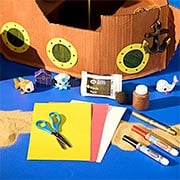
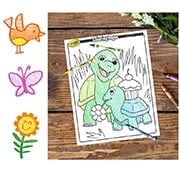
Learning
Resources for Students, Educators, & Families
Transform learning with engagement, collaboration, and creativity.
Browse All Learning Content -
Discover
Explore More from Crayola
Stay inspired with our latest creative campaigns, get the support you need, and discover the story behind the brand that brings color to life.
Explore Colors